Home & Kitchen brands grew traffic 4.5% in 2025 but conversion dropped 0.56pp. Price increases of 10.9% couldn't offset margin compression of 3.26pp. Operating margins hit negative 9% in November. The data reveals where revenue growth masked profitability problems.
More traffic, worse conversion. Higher prices, thinner margins. Download the report.
Download the full report
Used by the most loved brands in the world
Key takeaways
Traffic growth didn't translate to conversion: Glance views increased 4.5%, but fewer shoppers completed purchases (conversion down 0.56pp), indicating friction in the purchase path or weakened product-market fit
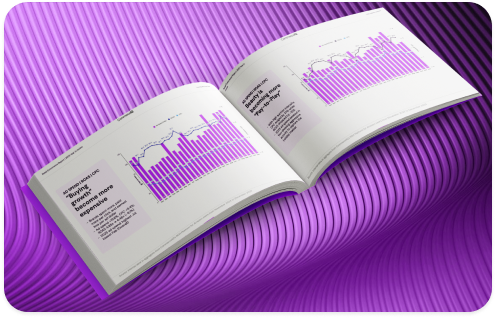
Price gains came at margin's expense: ASP rose 10.9% while discounting fell 2.25pp, yet unit margins dropped 3.26pp as cost inflation outpaced pricing power
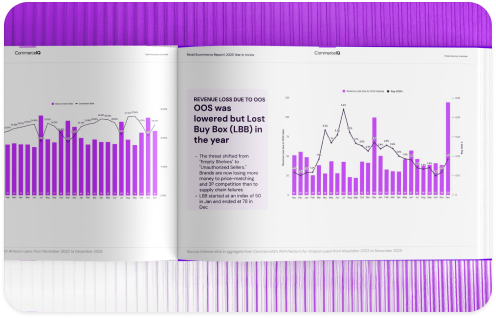
Fulfillment improved but Q4 exposed gaps: Fill rates jumped 11.6pp YoY, reaching 85% in March, but dropped to 69% in November when it mattered most
Inventory was higher but not better aligned: On-hand stock rose 16.3% YoY, yet OOS dollar loss increased 13.5%, proving that volume doesn't equal precision
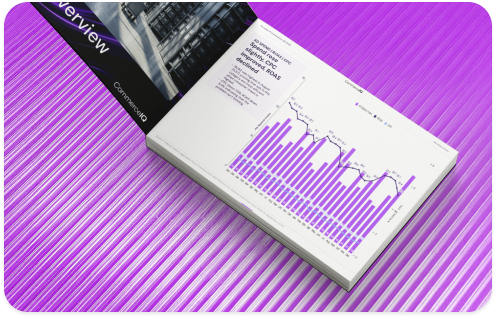
Paid media got slightly more efficient: ROAS improved 6.7% despite CPC rising 2.4%, showing optimization gains, but ad spend still grew 4.9% to maintain position
Profitability collapsed in Q4: Margins peaked at 18% in January but fell to negative 9% in November, exposing the true cost of holiday fulfillment and promotional activity