Office Products revenue stayed flat in 2025, but behind that number was a complete operational transformation. PO Fill Rate jumped from 64% to 91%, cutting out-of-stock losses and improving conversion even as traffic declined. The challenge? Unit margins compressed from 30.9% to 13.6% despite less discounting.
Download the report to see the full Office Products performance breakdown.
Download the full report
Used by the most loved brands in the world
Key takeaways
Execution fixes unlocked conversion: PO Fill Rate improved 22 percentage points from January to November, directly improving conversion rates and reducing revenue leakage from stockouts
Pricing stayed stable without heavy discounting: Average selling price (ASP) remained consistent year-over-year even as discount frequency swung from 28% in March to 6.8% in September
Margins compressed despite lower promotions: Unit margins fell from 30.9% to 13.6% mid-year as rising input costs and competitive pressure outweighed reduced discounting
Paid efficiency fell even with lower CPCs: CPC improved 7.5% but ROAS dropped 6.4%, proving the issue wasn't auction costs but declining organic traffic and demand
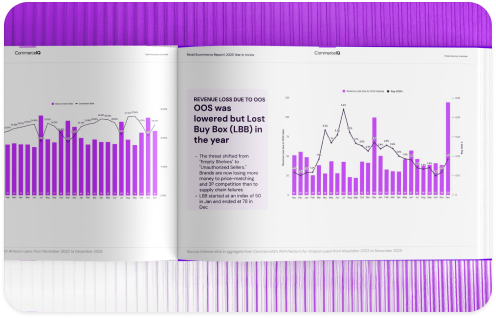
OOS leakage decreased materially: Revenue loss from out-of-stocks fell substantially as reported OOS rate dropped from 2.6% to 1.5%, validating operational improvements
Peak demand windows exposed remaining gaps: OOS dollar loss spiked in October and December, showing vulnerability during high-volume periods despite year-round execution gains