Tools & Home Improvement revenue stayed flat in 2025, but profitability took a hit. CPC rose 9.7% while ROAS fell 15.8%. Out-of-stock losses jumped 30% despite better fill rates. The cost of maintaining baseline performance became significantly more expensive.
Download the report to see where your category profitability went in 2025.
Download the full report
Used by the most loved brands in the world
Key takeaways
Steady demand, weaker economics: Revenue stayed flat while costs to acquire and convert customers rose materially, compressing profitability despite consistent consumer interest
Fulfillment improved but wasn't enough: PO Fill Rate climbed +7pp to 89%, yet operational gains couldn't offset deteriorating paid media returns and rising acquisition costs
Pricing power remained elusive: Promotional frequency fell 4.3pp, but ASP still declined 2.8%, proving competitive pressure prevented margin recapture through price increases
Paid efficiency deteriorated sharply: CPC rose 9.7% while ROAS fell 15.8%, creating a market where brands paid more per click and earned less per advertising dollar
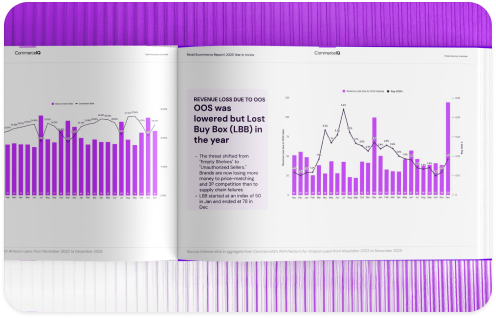
Forecasting gaps drove costly stockouts: OOS revenue loss increased 30% despite better fill rates, with sharp spikes in June and December revealing SKU-level prediction failures that cost the most when demand peaked
Margin volatility exposed planning risk: Unit margins fell to 14% in July before rebounding to 32% by September, exposing profitability volatility in a year-round category